Running simulations
Simulate mode runs individual vehicles over the lane graph. The engine advances in fixed time steps and is deterministic — the same network, demand and seed always reproduce the same run, which is what makes before/after comparisons meaningful.
Playback
The toolbar holds the playback controls: Play/Pause, Step (advance exactly one tick while paused) and Reset, which returns to time zero with the same seed while retaining the completed run for Analysis. Playback speed ranges from ¼× to 8× real time. The simulation runs in a background thread, so the interface stays responsive while thousands of vehicle decisions happen per second.
How vehicles drive
Vehicle behavior comes from established traffic-engineering models rather than scripted paths:
- Car following uses the Improved Intelligent Driver Model with constant-acceleration heuristics for realistic approach and braking behavior.
- Lane changes follow the MOBIL incentive model, including cooperative yielding at merges.
- Vehicles prepare lanes ahead of turns and exits based on their route, respond to signal phases, and reroute around closures.
- Driver profiles vary the model parameters per driver, so a cautious commuter genuinely follows at longer gaps than an aggressive one.
Watching and reading the run
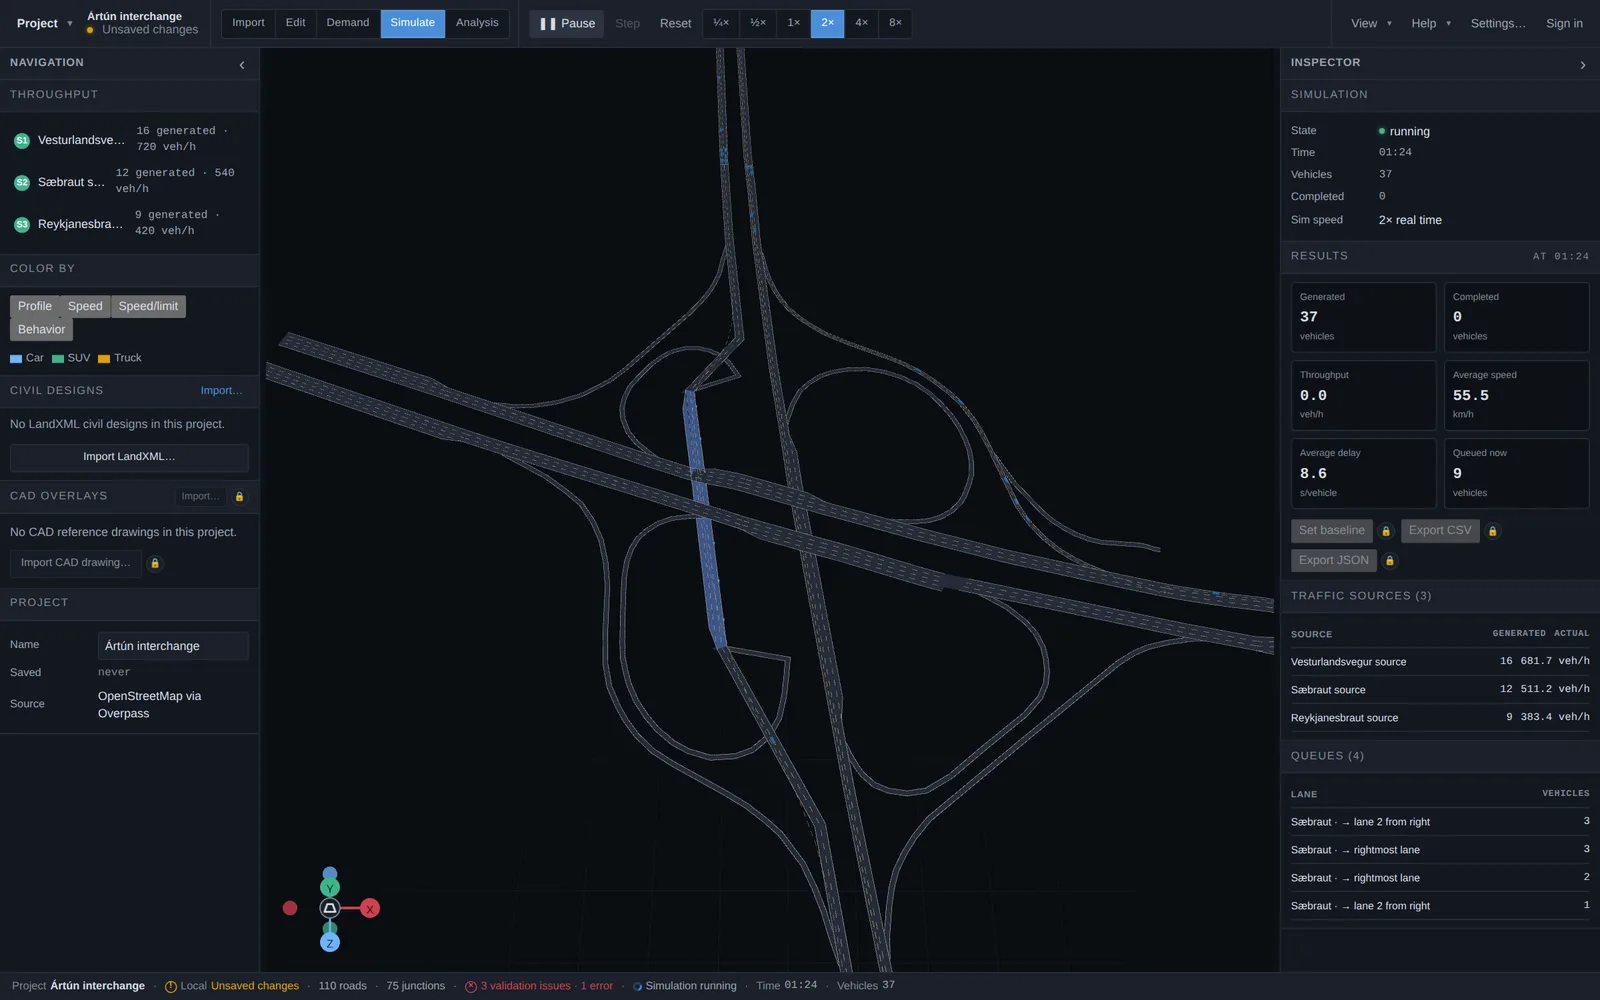
The left panel shows per-source throughput while the run progresses; the inspector shows live results — generated and completed vehicles, throughput, average speed, average delay and current queues, plus a per-lane queue list. Vehicles can be colored by profile, absolute speed, speed relative to the limit, or current behavior to make patterns visible at a glance.
“Set baseline” marks the current run as the reference to compare later runs against, and results can be exported as CSV or JSON on paid plans. Every completed run is retained for the Analysis workspace — see the next chapter.
Experiment settings: seed and warm-up
The Experiment panel in the left rail names the scenario, sets the random seed and defines a warm-up period. The seed controls every random draw — destination choice, vehicle and driver assignment, driver variation — so the same seed reproduces an identical run and a different seed samples a different realization of the same demand.
Warm-up (a typical study uses 15 minutes) marks how long the simulation should fill the empty network before results count: the run still starts at time zero, but summary statistics and Level-of-Service grades exclude everything before the boundary, and the analysis charts shade the excluded window.
Arrivals chooses how vehicles enter: Uniform spaces them evenly at the source's demand (the classic deterministic behavior), while Poisson draws random headways from the seed so arrival clustering varies between seeds the way real traffic does. Use Poisson whenever you intend to run several seeds and report confidence intervals — with uniform arrivals the runs differ less than reality would, and the intervals come out misleadingly tight.